Zendo FVG
Not every gap matters. This one watches five timeframes and marks the ones that agree.
What a fair value gap is
When price moves fast in one direction, it can leave a hole behind. Look at three candles in a row: if the first candle's high and the third candle's low never overlap, the space between them was skipped. Nobody traded there. That untraded space is a fair value gap.
Markets tend to be drawn back to those holes. Price often returns to fill the imbalance before continuing — which is why traders watch them as areas of interest.
Why overlap changes everything
A single gap is a hint. It might get filled, it might not.
But when gaps from several different timeframes land on the same price, that price stops being a hint and starts being a level. Independent imbalances all pointing at the same band is confluence.
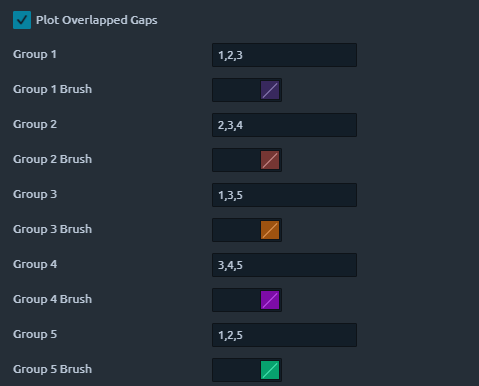
Zendo FVG runs the gap check on up to five timeframes at once, each reading its own data — so your chart period doesn't have to match what is being analysed. You choose which combinations count, and it draws only the shared band where every timeframe in that group has a live gap pointing the same way.
A zone doesn't die on the first break
Most gap indicators delete a zone the moment price trades through it. But a gap that fails is information — the level that stopped buyers often turns around and stops sellers.
So Zendo FVG flips it instead of deleting it:
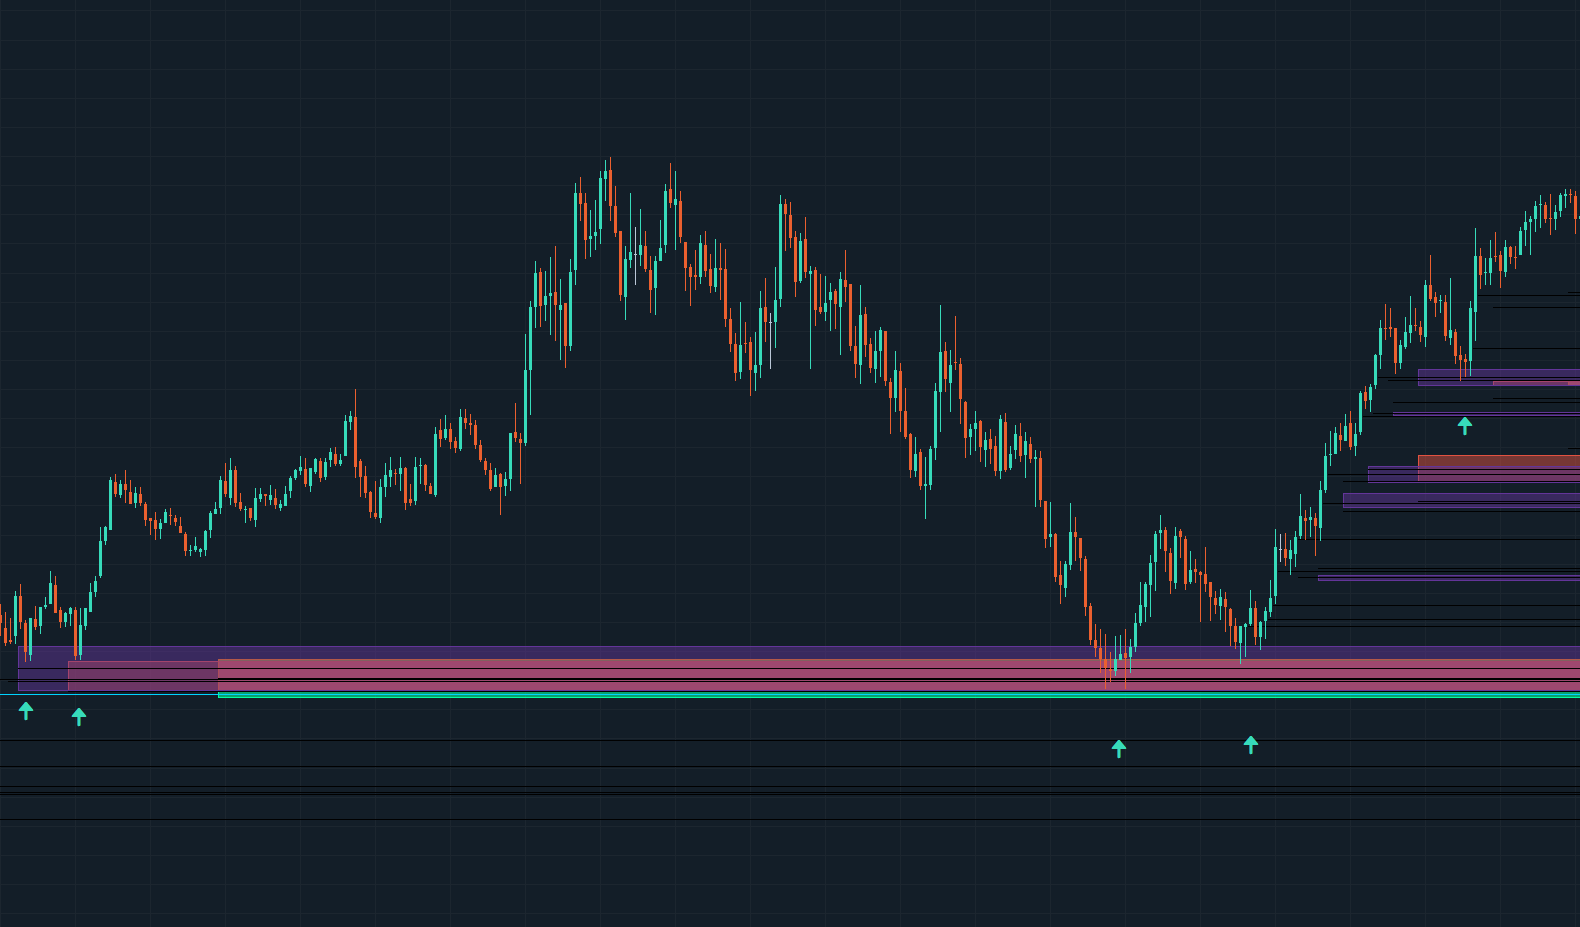
- The gap forms.Drawn in its timeframe's colour and carried forward until something happens to it.
- Price closes through it.The zone flips polarity — bullish becomes bearish — recolours, and stays live as an inverse gap. The edge it broke is remembered.
- Price reclaims that edge.Only now is the zone retired for good. It dies on the second break, not the first.
One rule keeps this honest: inverse zones cannot create confluence. A gap that already failed is never counted toward a new overlap, so you never get a confluence zone manufactured out of broken levels.
What it looks like live
Four screenshots, in the order you would actually meet them: set your timeframes, decide what counts as confluence, then watch what gets drawn.
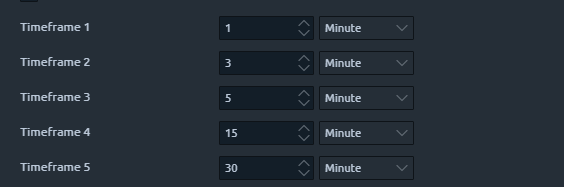
1 · Pick your timeframes
2 · Decide what counts as confluence
3 · Watch the zones hold
4 · The noise gets filtered out
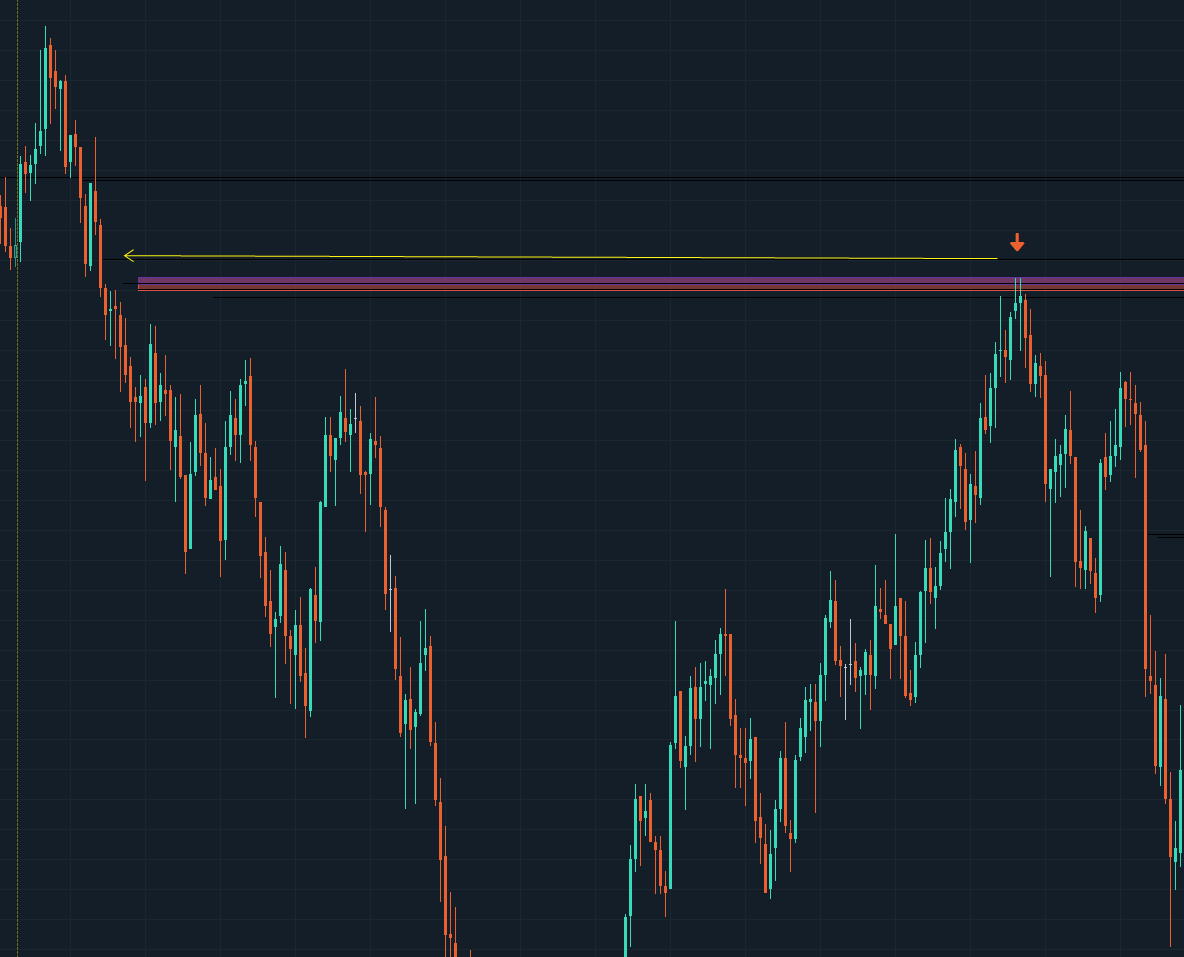
That is the whole point. Any gap tool will show you fifty levels. This one shows you the handful that more than one timeframe is willing to defend.
Four things it handles for you
Five timeframes at once
Runs the three-candle gap check on each timeframe independently, on its own data — no flipping charts to see what the higher frame is doing.
Draws only the agreement
You define which timeframe combinations count. It marks the shared band where every one of them has a live gap in the same direction.
Tracks the failures
Broken gaps flip and stay live as inverse zones, then retire on reclaim — so a failed level keeps working for you instead of vanishing.
Tunes to your chart
Gap size limits, colours per timeframe and per group, 50% midpoints, zones that shrink as price eats in, and an optional Bollinger overlay.
- Platform
- Quantower today — custom C# indicator
- Timeframes
- Five slots, default 1m / 3m / 5m / 15m / 30m
- Groups
- Up to five overlap combinations, each its own colour
- Updates
- On bar close — nothing redraws mid-candle
- Filters
- Minimum and maximum gap size in ticks; invalidate on close or on wick
- In development
- A TradingView build, with more platforms to follow
It is a lens, not a signal. Zendo FVG shows you where imbalances stack — it does not tell you to buy or sell. You still bring the trend read, the sizing, and the exit. That is the part we teach inside the hall.
Included with every membership
Zendo FVG is not sold separately and is not available anywhere else. It comes with your Zendo membership, alongside the live sessions, alerts, and breakdowns — and we walk through how to actually use it, which matters more than having it.
It runs in Quantower today. A TradingView build is in development and more platforms will follow.
Start your 3-day free trialThen $99/month · cancel anytime